
Introduction
Key Performance Indicators (KPIs) and metrics are essential tools that help businesses measure performance and track progress toward their goals. In simple terms, KPIs are specific, goal-oriented measurements, while metrics are the data points that support those measurements. This concept of Key Performance Indicators Explained helps organizations understand what truly matters, whether it’s increasing sales, improving customer satisfaction, or boosting website traffic.
For businesses, marketers, and startups, understanding KPIs is crucial for making informed decisions and driving growth. Without proper tracking, it becomes difficult to know what’s working and what needs improvement. This KPI Measurement Guide for Beginners provides a clear starting point, helping you focus on the right data, avoid confusion, and build strategies based on real performance insights rather than guesswork.
What Are KPIs? (Key Performance Indicators Explained)
Key Performance Indicators (KPIs) are measurable values that show how effectively a business, team, or individual is achieving specific goals. In simple terms, KPIs help you understand whether you are moving in the right direction or falling behind. They are usually tied to strategic objectives, making them more focused and meaningful than general data or random numbers.
KPIs are important because they provide clarity, direction, and measurable progress. Instead of relying on assumptions, businesses can use KPIs to make data-driven decisions, improve performance, and stay aligned with their goals. They also help teams stay accountable and focused on what truly matters, whether it’s increasing revenue, improving customer experience, or optimizing operations.
Real-life examples of KPIs can be seen across different areas of a business. In sales, a KPI might be monthly revenue or conversion rate. In marketing, it could be website traffic, lead generation, or cost per acquisition. In operations, KPIs often include efficiency rates, production output, or turnaround time. These examples show how KPIs turn goals into measurable outcomes, making success easier to track and achieve.
KPIs vs Metrics – What’s the Difference?
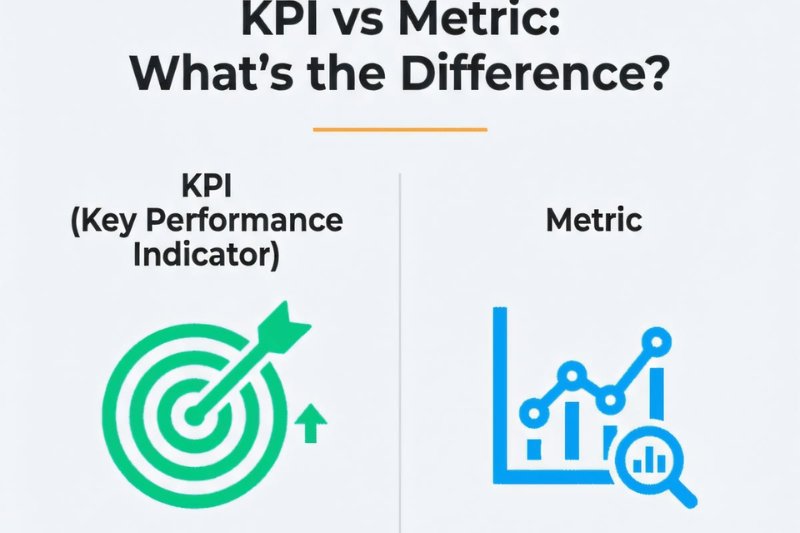
Many beginners confuse KPIs with metrics, but they are not the same. While both are used to measure performance, the key difference lies in their purpose and importance. KPIs are directly tied to business goals and show whether you’re achieving success, whereas metrics are the supporting data that provide additional context.
Simple Comparison Table
| Aspect | KPIs (Key Performance Indicators) | Metrics (Supporting Data) |
|---|---|---|
| Purpose | Measure progress toward key goals | Track general performance data |
| Focus | Strategic and goal-oriented | Operational and detailed |
| Importance | High (critical for decision-making) | Medium (supports analysis) |
| Example | Monthly revenue growth | Number of daily website visitors |
| Usage | Helps evaluate success or failure | Helps understand trends and patterns |
In simple terms, KPIs = strategic, meaning they directly reflect whether your business is on track to achieve its objectives. On the other hand, metrics = supporting data, which help explain the performance behind those KPIs. Understanding this difference is essential for better decision-making and more effective performance tracking.
Types of KPIs You Should Know
Understanding different types of KPIs helps you track performance across all areas of your organization. These categories cover the Important Marketing and Business Metrics that drive growth, profitability, and efficiency.
Business KPIs
Business KPIs focus on the overall financial health and long-term success of a company. These indicators help leaders understand whether the business is growing and generating sustainable profits.
- Revenue Growth: Measures how much your income is increasing over time
- Profit Margin: Shows how much profit you retain after expenses
Marketing KPIs
Marketing KPIs evaluate how well your campaigns are performing and whether they are bringing in valuable customers. These are among the most Important Marketing and Business Metrics for scaling a brand.
- Conversion Rate: Percentage of visitors who take a desired action (like making a purchase)
- Customer Acquisition Cost (CAC): The cost of acquiring a new customer
Operational KPIs
Operational KPIs focus on internal processes and efficiency. They help businesses optimize performance and reduce waste.
- Efficiency: Measures how well resources are being used
- Productivity: Tracks output relative to input (e.g., work done per employee)
By monitoring these KPI categories, businesses can gain a complete view of their performance and make smarter, data-driven decisions.
How to Track Business Metrics Effectively
Understanding How to Track Business Metrics Effectively is essential for turning raw data into meaningful insights. Without a proper tracking system, businesses often collect data but fail to use it for growth. The key is to combine the right tools, clear goals, and consistent monitoring to get accurate results.
First, use reliable tools to collect and organize your data. Platforms like Google Analytics help track website performance, while dashboards and CRM systems provide a centralized view of customer and business data. These tools allow you to monitor multiple metrics in one place, making it easier to identify trends and measure progress over time.
Next, set measurable and realistic goals for each metric you track. Instead of vague targets, define clear benchmarks such as increasing website traffic by 20% or reducing customer acquisition cost by a specific percentage. This ensures your metrics are aligned with business objectives and gives you a clear direction.
Finally, maintain a consistent tracking frequency. Depending on your business needs, you can monitor metrics daily, weekly, or monthly. Regular tracking helps you quickly identify issues, adjust strategies, and stay on course toward your goals. By following these steps, you can build a strong system for tracking and improving your business performance.
KPI Measurement Guide for Beginners
A simple KPI Measurement Guide for Beginners helps you turn business goals into clear, trackable results. Instead of guessing performance, you follow a structured process that ensures every KPI you choose is meaningful and aligned with your objectives.
1. Define your business goal
Start by clearly identifying what you want to achieve. This could be increasing sales, improving customer retention, or growing website traffic. A well-defined goal gives direction to everything that follows.
2. Choose the right KPI
Select KPIs that directly reflect your goal. For example, if your goal is sales growth, relevant KPIs could be revenue, conversion rate, or average order value. Avoid choosing too many KPIs—focus only on what truly matters.
3. Set benchmarks
Benchmarks help you understand what “success” looks like. Compare your current performance with past data, industry standards, or competitor insights to set realistic targets.
4. Track progress
Monitor your KPIs regularly using tools like dashboards, spreadsheets, or analytics platforms. Consistent tracking helps you see trends and identify issues early.
5. Adjust strategy
Based on your KPI results, refine your strategy. If performance is below expectations, analyze the cause and make necessary improvements to stay on track.
Following these steps ensures a clear and effective approach to KPI measurement.
Data Metrics Analysis Made Simple
Understanding Data Metrics Analysis Made Simple is all about breaking complex data into clear, actionable insights. Many beginners feel overwhelmed by numbers, but the key is to focus on what the data is actually telling you instead of trying to analyze everything at once.
To read data without confusion, start by focusing on a few key indicators that align with your goals. Avoid getting distracted by unnecessary numbers or vanity metrics. Look at data in context—compare it over time rather than viewing it as isolated figures. This helps you understand whether performance is improving, declining, or staying stable.
Identifying trends is the next important step. Trends show patterns in your data, such as consistent growth in website traffic or a drop in conversion rates. These patterns help you make informed predictions and adjust strategies early before problems grow.
Finally, avoid common mistakes like over-analyzing too many metrics, ignoring context, or making decisions based on short-term fluctuations. Good data analysis is about simplicity, consistency, and focusing on what truly impacts your KPIs and business goals.
You may also read this:
The 12 Best Analytics Blogs (Crazy Egg Guide)
Warmforge AI Blog – Email Deliverability & Cold Outreach Insights
How to Tag Blog Posts for SEO – Complete Guide (UsePattern)
Datos Insights Blog – Financial Services & Analytics Research
Blog Analytics Guide: How to Use Data to Improve Your Strategy – HostAdvice
Common KPI Tracking Mistakes to Avoid
Tracking KPIs can significantly improve decision-making, but only when done correctly. Many businesses struggle not because they lack data, but because they misuse it. Avoiding a few common mistakes can make your KPI system far more effective and meaningful.
One of the biggest mistakes is tracking too many KPIs at once. When everything is labeled important, nothing truly stands out. This leads to confusion and makes it difficult to focus on what actually drives results. It’s better to prioritize a few key KPIs that directly reflect your main objectives.
Another common issue is ignoring actionable insights. Collecting data is not enough—what matters is how you use it. If you are not analyzing trends or making decisions based on KPI results, the tracking process loses its value. Data should always lead to action and improvement.
Finally, many organizations fail to align KPIs with business goals. When KPIs are not connected to strategic objectives, they become meaningless numbers. Every KPI should clearly support a specific goal, whether it’s increasing revenue, improving efficiency, or boosting customer satisfaction. Proper alignment ensures your efforts lead to real business growth.
Best Tools for KPI Tracking
Choosing the right tools is essential for effective KPI monitoring. The best tools not only help you collect data but also make it easier to analyze performance and make informed decisions based on real-time insights.
Google Analytics is one of the most widely used tools for tracking digital KPIs. It helps you measure website traffic, user behavior, conversion rates, and other key online performance indicators. This makes it especially useful for marketing and e-commerce businesses.
Excel / Google Sheets are simple yet powerful tools for KPI tracking. They allow you to create custom dashboards, organize data, and calculate performance trends manually or with formulas. These tools are flexible and ideal for small businesses or beginners who want full control over their data.
CRM tools (Customer Relationship Management systems) like Salesforce or HubSpot help track customer-related KPIs such as leads, sales pipelines, and customer retention. They centralize customer data and provide detailed reports, making it easier to monitor sales performance and improve customer relationships.
Using a combination of these tools ensures more accurate tracking, better insights, and stronger decision-making for business growth.
Conclusion
KPIs and metrics play a crucial role in helping businesses understand performance and make informed decisions. While metrics provide detailed data points, KPIs focus on the most important goals that drive growth, such as revenue, conversions, efficiency, and customer satisfaction. Together, they create a clear picture of how a business is performing and where improvements are needed.
The key to success is not tracking everything, but tracking what truly matters. Smart tracking means focusing on the right KPIs, using data effectively, and avoiding unnecessary complexity. When businesses avoid over-tracking and stay aligned with their goals, they can turn data into meaningful action and achieve consistent, long-term growth.
FAQs (Frequently Asked Questions)
1. What is a KPI (Key Performance Indicator)?
A KPI (Key Performance Indicator) is a measurable value used to evaluate how effectively a business or individual is achieving a specific goal. It helps track performance and measure success over time.
2. What is the difference between KPIs and metrics?
KPIs are strategic measurements focused on key business goals, while metrics are general data points that support analysis. KPIs show success, and metrics help explain performance.
3. Why are KPIs important for businesses?
KPIs are important because they help businesses track progress, make data-driven decisions, and stay aligned with their goals such as revenue growth, customer satisfaction, or efficiency.
4. How do I choose the right KPI (Key Performance Indicator)?
You should choose KPIs based on your business goals. A good KPI should be specific, measurable, relevant, and directly connected to your desired outcome.
5. What are common business KPIs (Key Performance Indicators)?
Common business KPIs include revenue growth, profit margin, customer retention rate, and conversion rate. These indicators show overall business performance.
6. What are marketing KPIs (Key Performance Indicators)?
Marketing KPIs include metrics like website traffic, conversion rate, customer acquisition cost (CAC), and return on investment (ROI), which measure campaign effectiveness.
7. How often should KPIs (Key Performance Indicators) be tracked?
KPIs should be tracked regularly depending on your business needs—daily, weekly, or monthly. Frequent tracking helps identify trends and fix issues early.
8. What tools are used for KPI (Key Performance Indicator) tracking?
Popular tools include Google Analytics, Excel or Google Sheets, and CRM systems like HubSpot or Salesforce, which help monitor and analyze performance data.
9. What are operational KPIs (Key Performance Indicators)?
Operational KPIs measure internal business efficiency, such as productivity, workflow speed, and resource utilization, helping improve day-to-day operations.
10. What is KPI (Key Performance Indicator) analysis?
KPI analysis is the process of reviewing performance data to understand trends, measure success, and make improvements based on insights from tracked KPIs.
You may also read this:
45 Best Analytics Blogs to Follow in 2026
12 Must-Read Data Analytics Blogs – Medium
GPS Tracking Blog – TrackingTheWorld